Google Analytics
Google Analytics is available for all KU websites within the ku.edu domain.
Marketing Communications, in partnership with KUIT, have created an enterprise solution that uses Google's Universal GA code.
Each site can be configured to work with Google Analytics.
Google Analytics provides statistics and tracking data that details, among other things: who is visiting your site, where they are coming from, and the technologies they are using to access your site.
To obtain a Google Analytics universal account, upgrade your existing account, or request a consultation:
A member of Marketing Communications’ interactive media team will email you with the timing of the next planned analytics installment, which takes place monthly.
If you'd like additional users to have access, include their Google IDs with the request form. You may also add additional users yourself once your Google Analytics account has been set up.
How to get access to your site's Google Analytics information:
If your site was already set up with a Google Analytics code, the person who initially requested the account can give you access.
How to access your Google Analytics statistics:
Once your Google Analytics code is embedded in your site, your website traffic and statistics will begin to be tracked. To access that information:
- Go to google.com/analytics.
- Click on Sign in and log on with your Google ID and password. Note: If you already are signed in to Google, you may need to select Access Analytics instead. If you do not have a Google ID, start here.
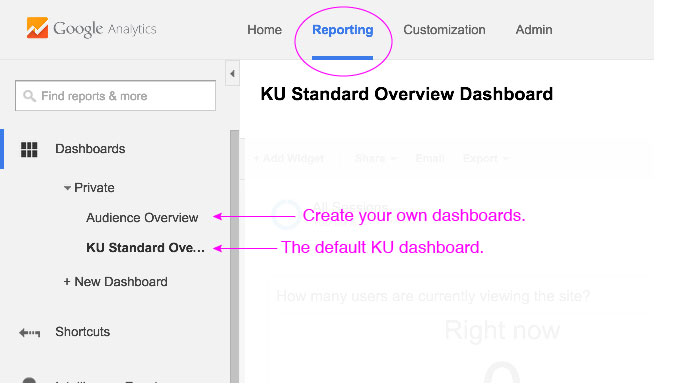
How to read or analyze your Google Analytics dashboards:
Dashboards are a collection of widgets that give you an overview of the reports and metrics you care about most. Dashboards let you monitor many metrics at once, so you can quickly check the status and performance of your accounts, or see correlations between different reports.
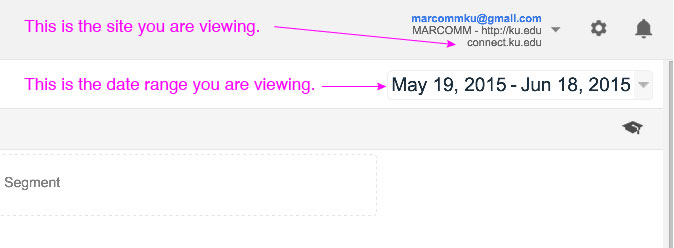
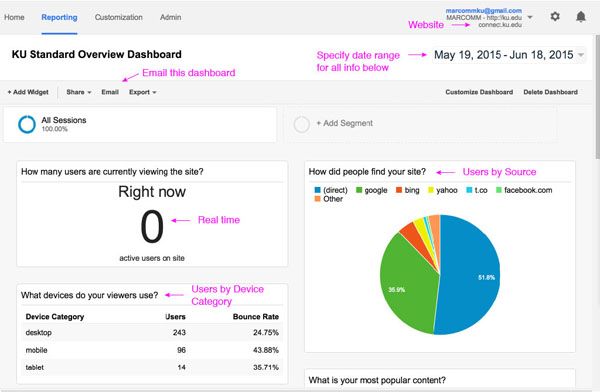
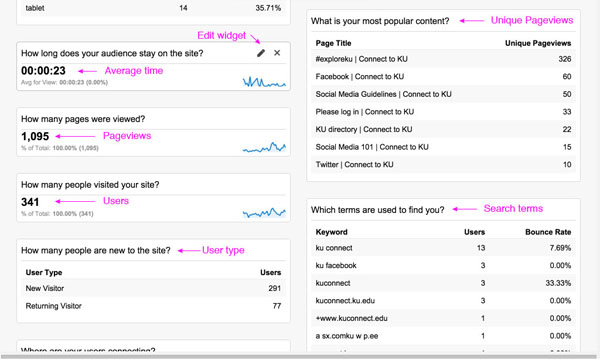
Each view in your Google Analytics account can display a private dashboard called “KU Standard Overview Dashboard” that is pre-populated with a number of widgets showing your site’s traffic as measured via certain key metrics and dimensions:
- Active users currently online
- A pie chart detailing how users found your site
- A table of users by browser
- Timelines for average time on page
- Pageviews, visits, and other data
To add the KU standard dashboard, follow this link when signed into your Google Analytics account. This dashboard may be sufficient for your needs. If not, you can customize it by adding or rearranging the widgets, adding reports, removing unwanted widgets, or filtering the data displayed. You can also create additional dashboards devoted to different aspects of your site traffic.
To learn more about dashboard customization, visit https://support.google.com/analytics/answer/1068218?hl=en.
KU Standard Dashboard Screenshots:
How to read or analyze your Google Analytics reports:
A custom report is a report that you create. You pick the dimensions and metrics and decide how they should be displayed. Your ku.edu analytics account comes with a standard report called “KU Standard Overview Report” that is pre-populated with dimensions and metrics classified into three different tabs. Add it to your account here while logged into your Google Analytics account.
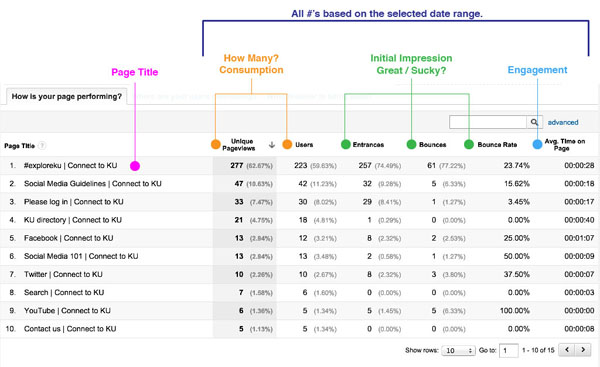
How is your page performing? Collects key page performance metrics broken down by page title that will help you identify which pages are performing the best and which need a little optimization. It’s especially useful for sites that produce a lot of content or add new pages frequently.
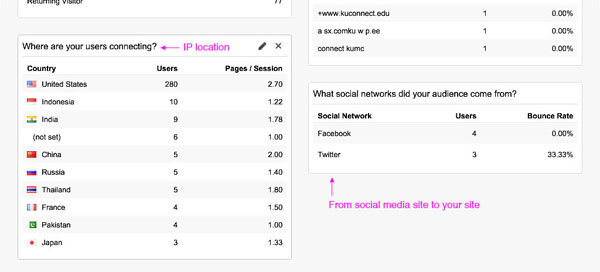
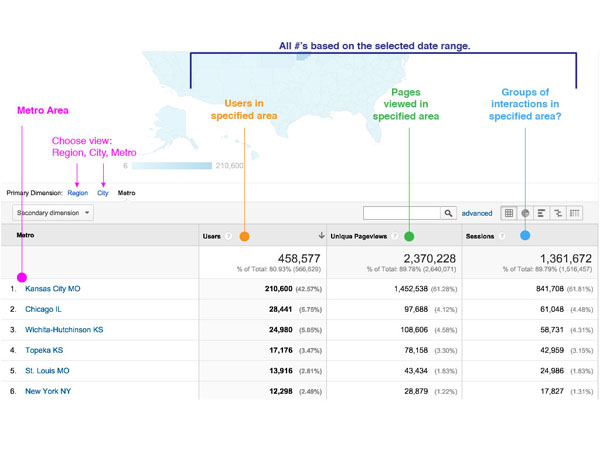
Where are your users connecting? Breaks down user data by metro area and includes a map based on this data. This data can help you plan site content and coordinate external marketing campaigns across social channels or online advertising services.
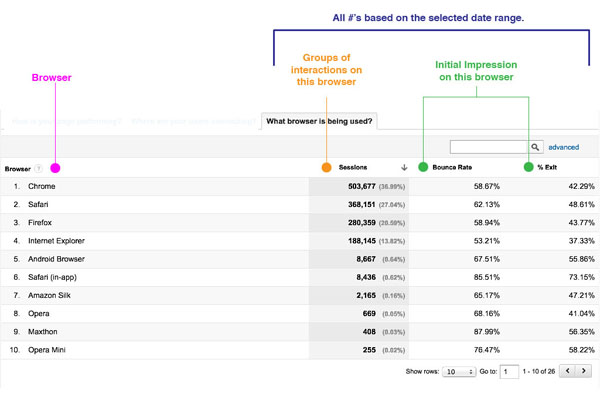
What browser is being used? Shows compatibility issues with your site’s code and how it renders on popular browsers.
KU Standard Report Screenshots:
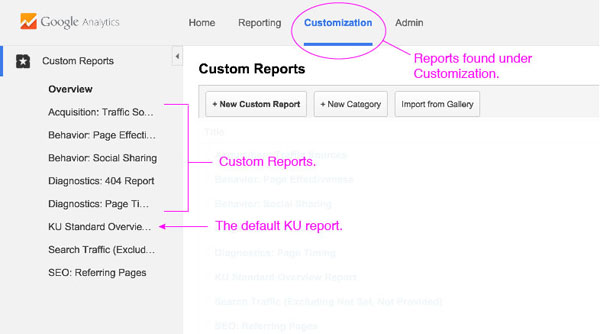
To see Custom Reports:
- Sign in to your Google Analytics account.
- Select the Customization tab, at the top of any page in Analytics.
- Select Custom Reports in the left navigation. Your reports will be listed in the left navigation under Custom Reports.
Want to learn more? Google offers online training courses and guides on how to get started and use Google Analytics. Please refer to these links:
- Google Analytics Academy (free): https://analyticsacademy.withgoogle.com/explorer
- Google Analytics YouTube Channel: http://www.youtube.com/user/googleanalytics
- Google Analytics Help: https://support.google.com/analytics/#topic=3544906
- Create and manage Custom Reports: https://support.google.com/analytics/answer/1151300?rd=1